
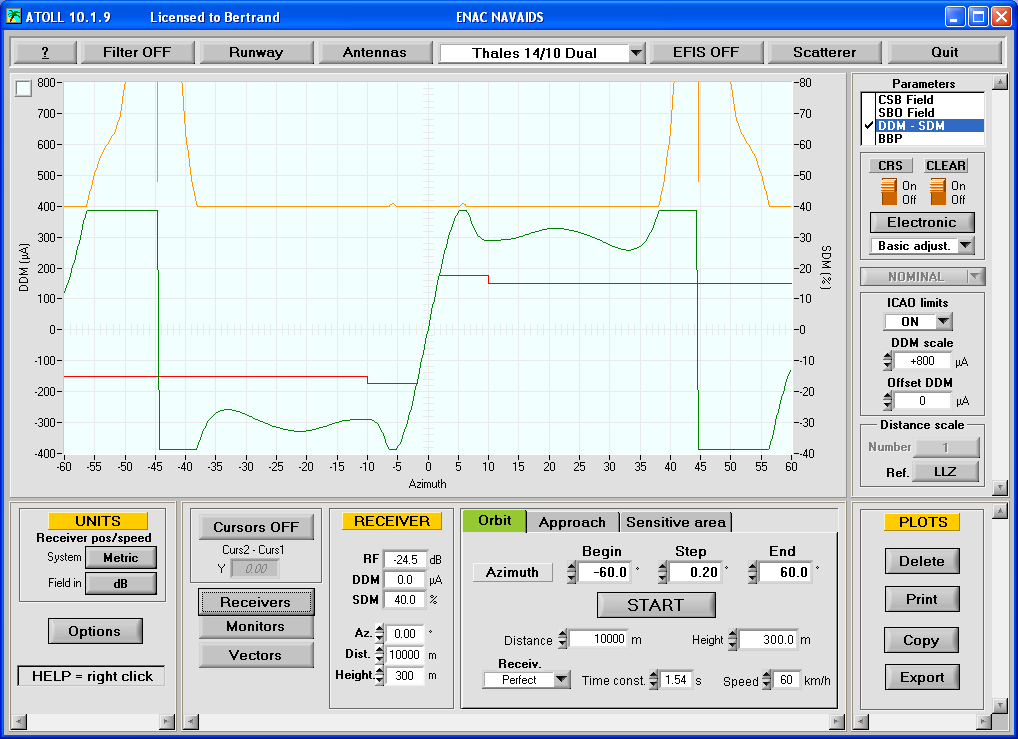
ATOLL (Advanced Trainer On Localizer
The software is organized around the main panel that displays the curves and gives access to the different adjustment and configuration panels.
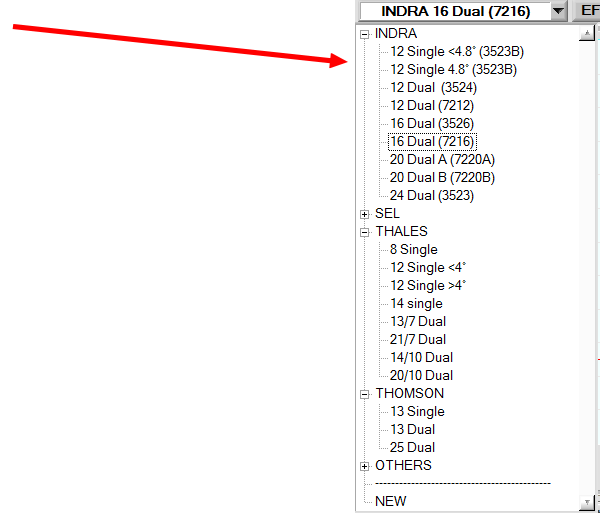
A wide range of antenna arrays can be simulated.
It is also possible to build its own array and save it for further use.
Simulation of transmitter
Several transmitter types are available.
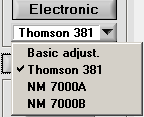
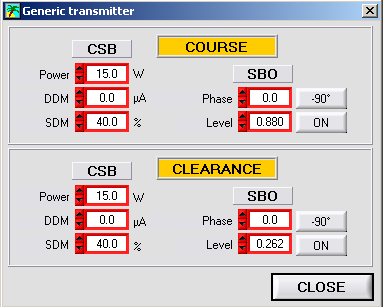
Basic adjustment gives access to the basic adjustments
of a generic transmitter not related to a manufacturer.
Thomson 381/389 transmitter
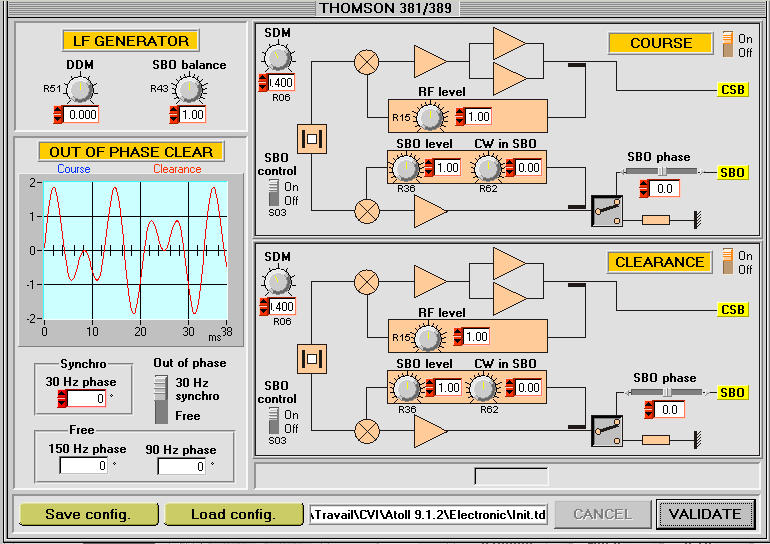
This panel gives access to the main adjustments for this transmitter. It is also possible to simulate Out-of phase clearance even if this feature is not available on the real equipment.
Normarc 7000A transmitter
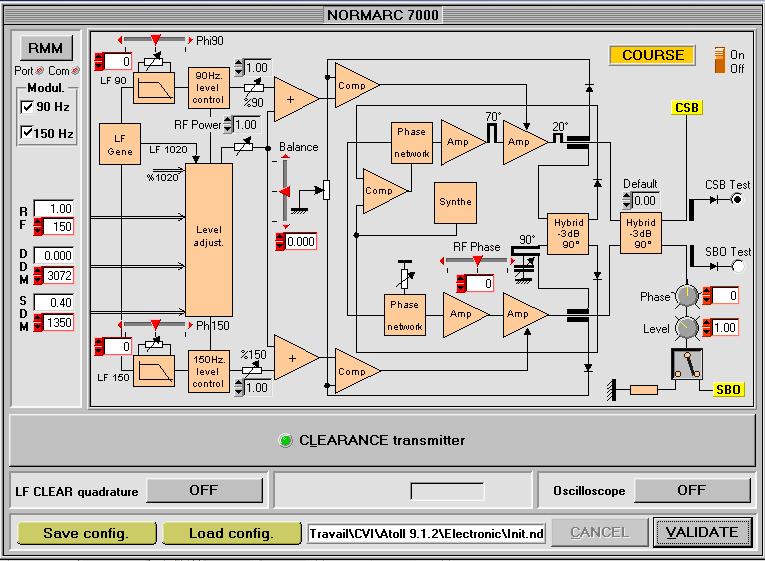
This panel gives access to all digital and analogue adjustments available on this equipment. With the RMM button you can open a communication port that allows connecting the Normarc RMM software to the transmitter. In that case all digital adjustments are made through the RMM software like on real equipment.
Normarc 7000B transmitter
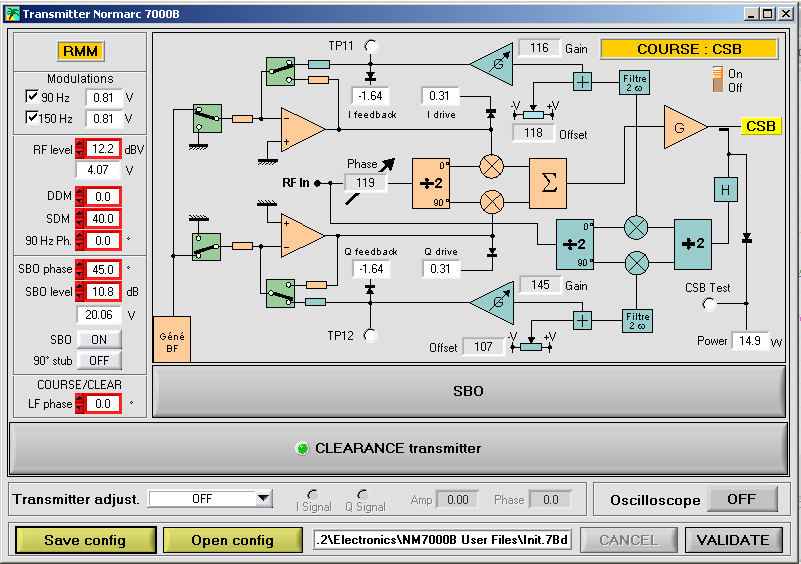
This panel gives access to all adjustments on this equipment.
It is possible to connect with the RMM from INDRA to ATOLL. In this case the RMM sees ATOLL as a real cabinet and all maintenance operations can be performed like on the real equipment including ground and flight checks.
Workshop mode
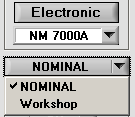
In workshop mode the digital displays of the adjustments are hidden.
It is then possible to ask the user to load a file with some maladjustment and to apply the adjustment procedures to obtain again an in tolerance radiated signal.
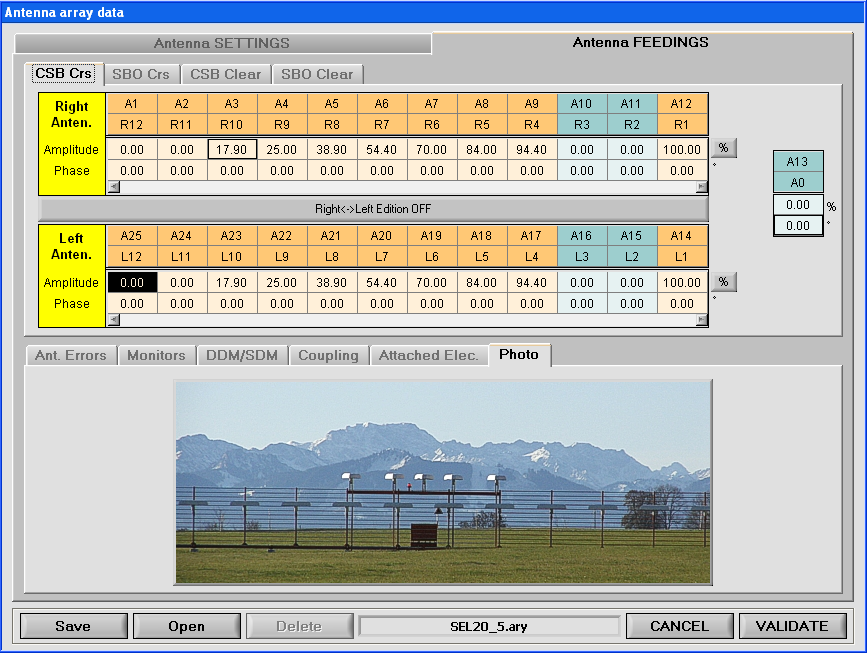
Antenna array edition panel
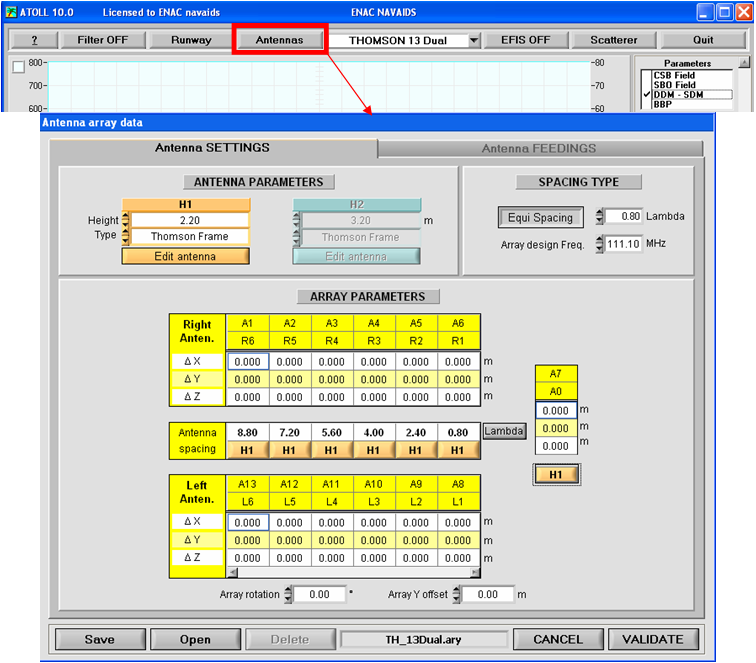
This panel contains 2 tabs, one for the mechanical settings of the selected array and the other for the antenna feedings (see below) and simulation of faults (attenuation and phase shift) in the antennas or distribution unit, displaying DDM and SDM in each antenna and more.
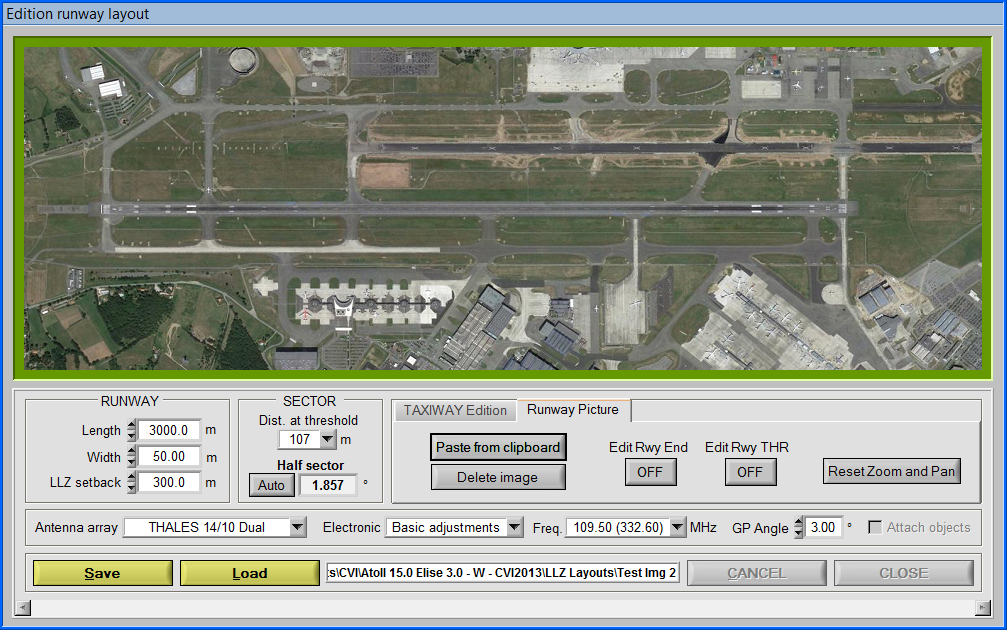
Runway settings
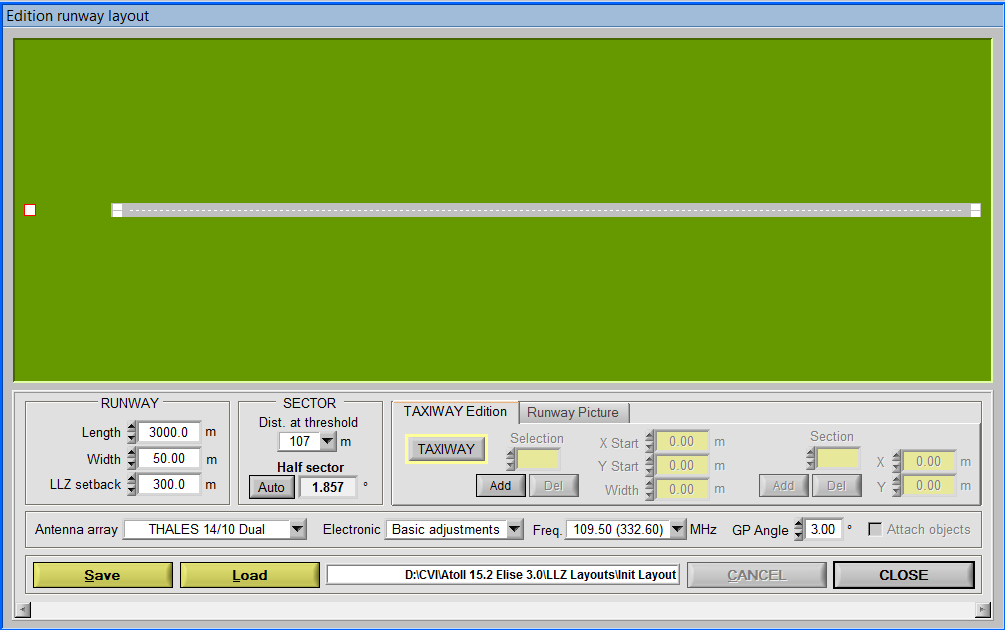
This panel allows adjusting the runway features. It calculates automatically the sector width and adjusts the corresponding SBO level in the transmitter. It is also possible to save a complete runway layout including the antenna array type and station frequency for later use.
One can also import a picture from Google Earth or from a drawing software as a background for the plots.
Scatterer panel
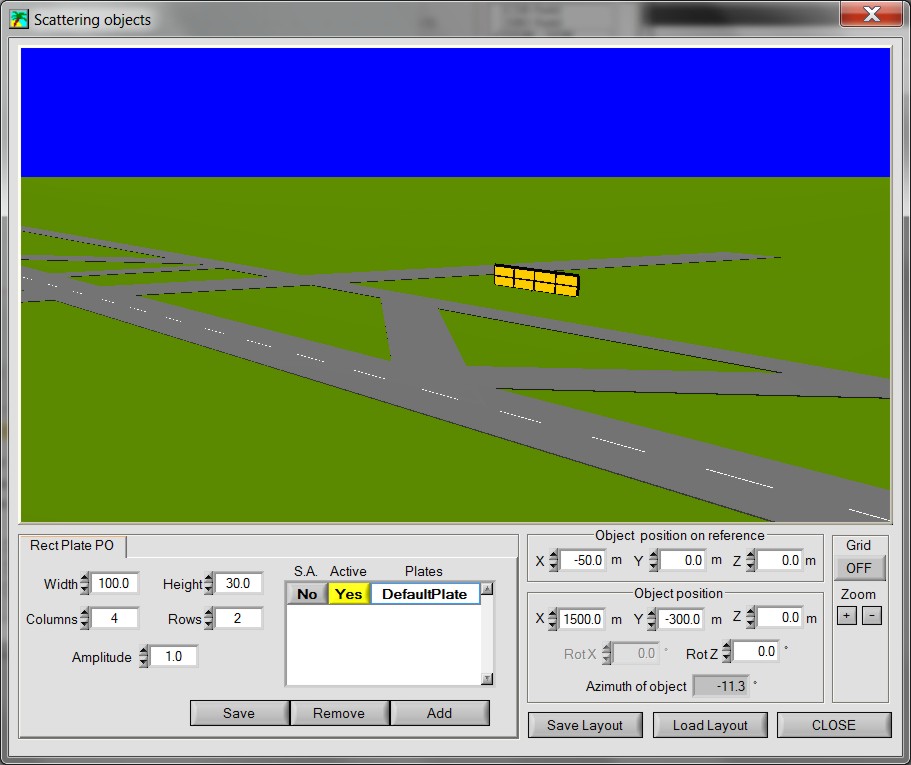
With this panel it is possible to add some scattering objects in order to simulate buildings or taxiing planes. The calculation uses the method of Physical Optics to evaluate the effect of the object on the ILS signal.
Measurement modes
Several measurement modes are available:
- Orbit run
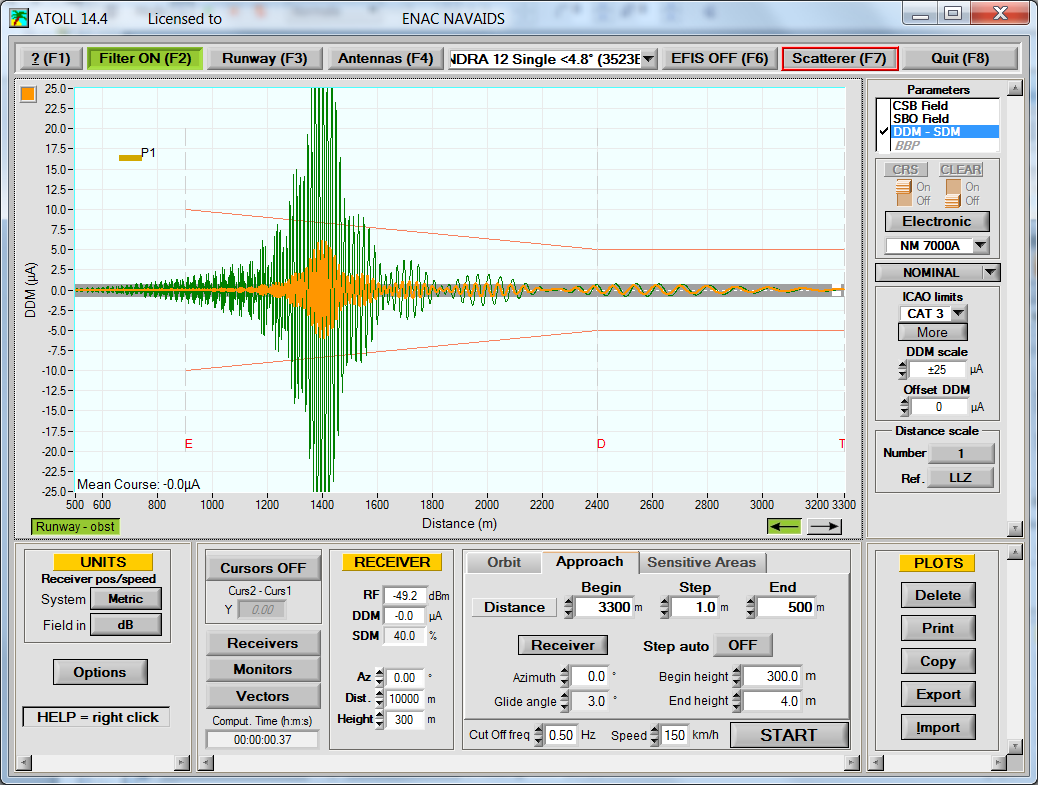
- Approach
- Sensitive area calculation
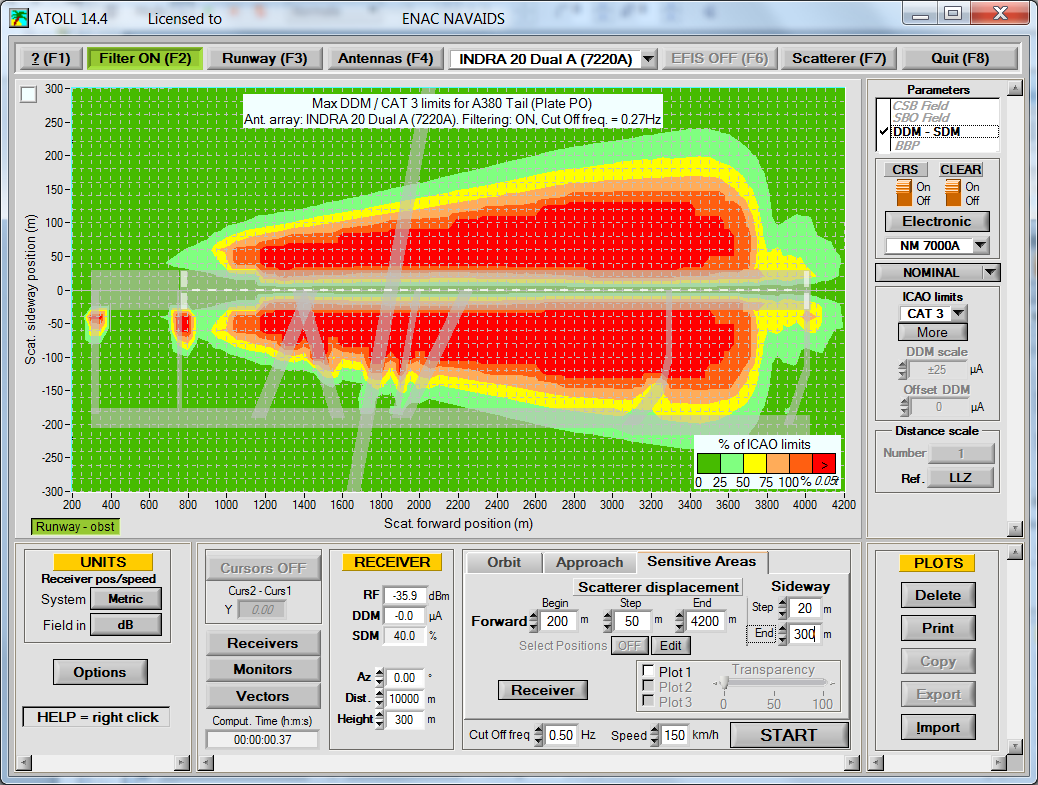
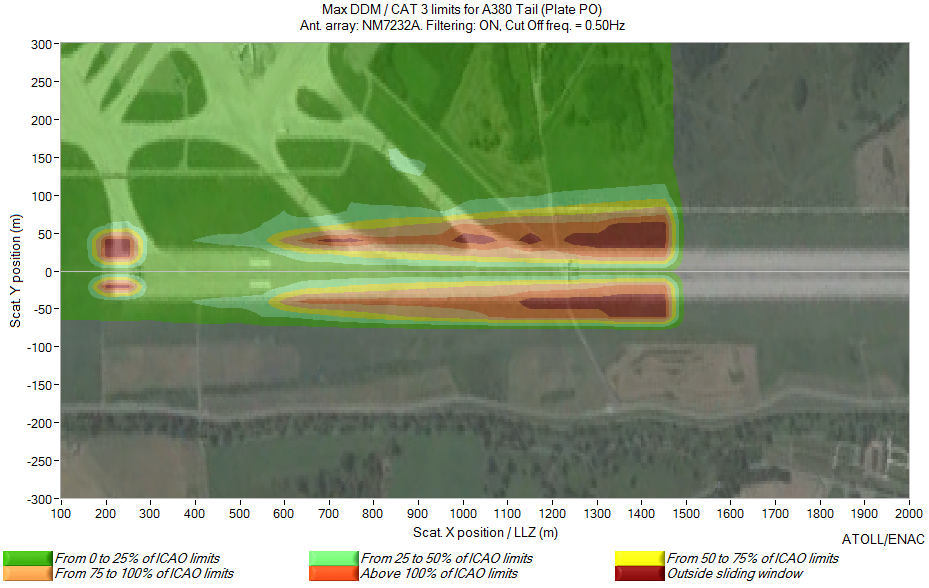
Sensitive area with Google Earth background
- Moving object mode
With the Moving Object tab it is possible to simulate the reflections from a moving object on a static or a moving receiver.
Example of a simulation and a measurement made in the same conditions with a flight inspection plane approximately 6 NM behind a landing aircraft.
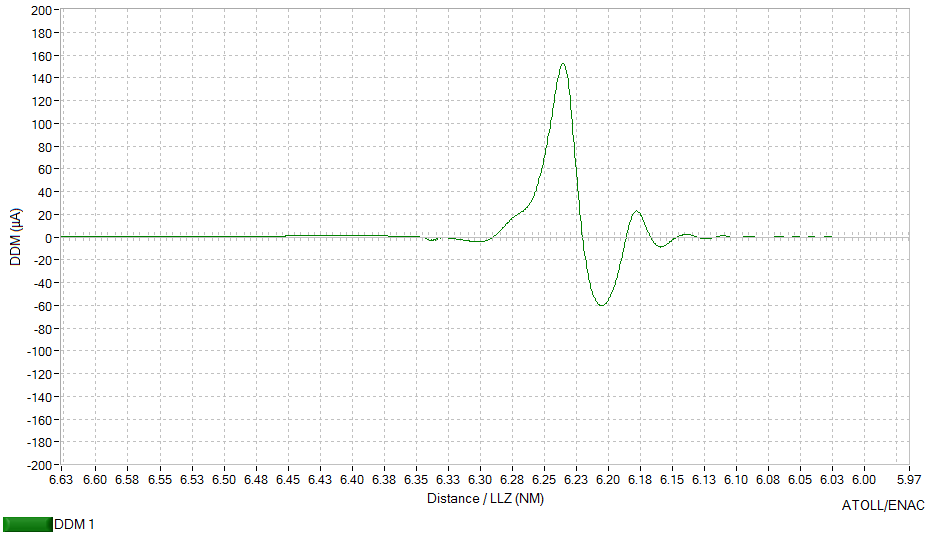
Simulation
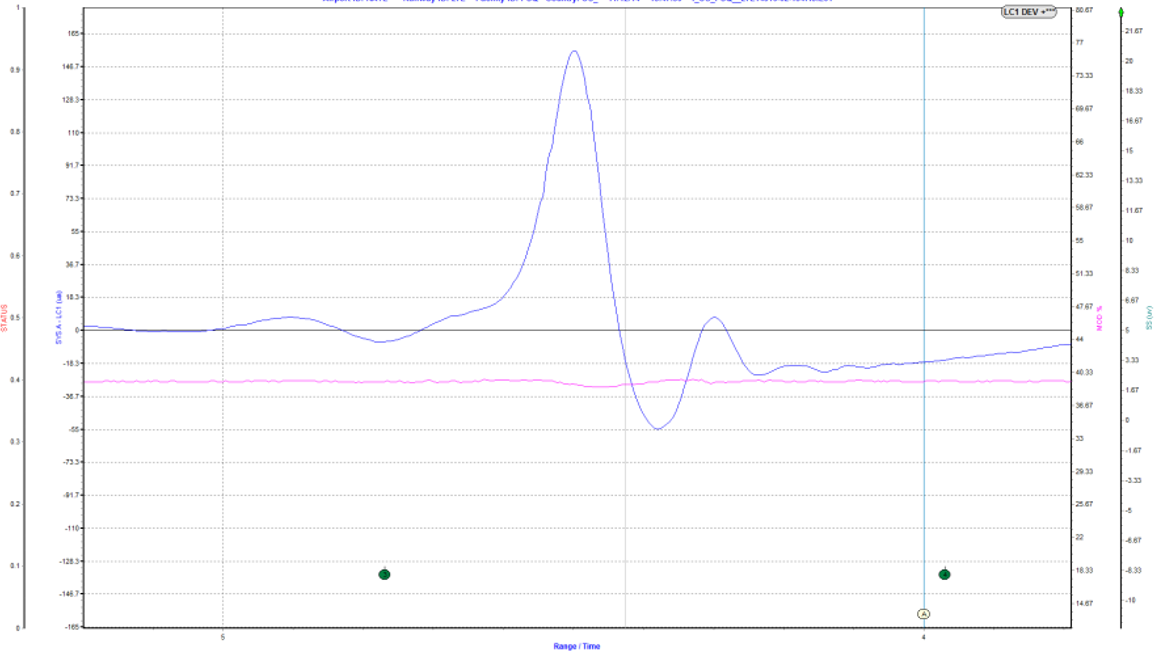
Measurement
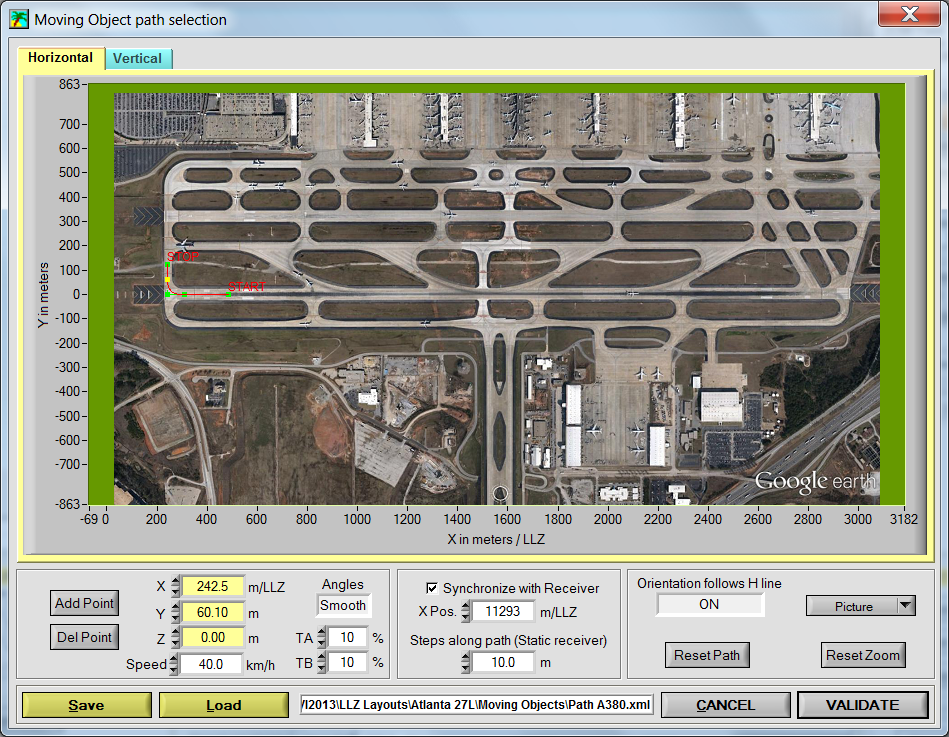
Panel for selecting a path of the moving object
- Static receiver
The static receiver allows measuring the localizer parameters at a given position in space
- Monitors
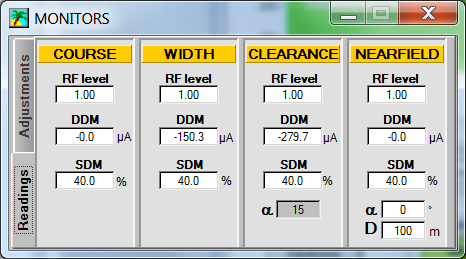
In this panel it is also possible to set the alarm limits. If a values reaches the warning or alarm limits the background turns yellow or red.
Vector diagrams
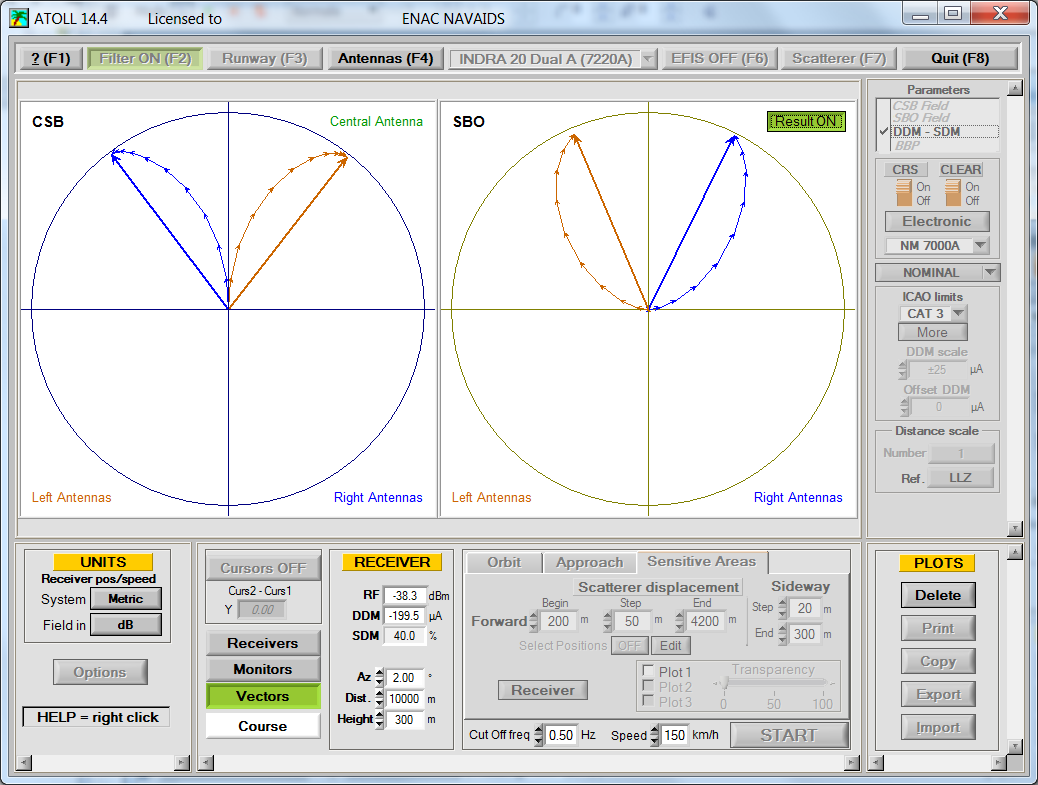
This panel shows the vectors of the signals received by a receiver from each antenna as. This is helpful to get a good understanding on how the radiation patterns are generated and to analyse some faults in the antennas.
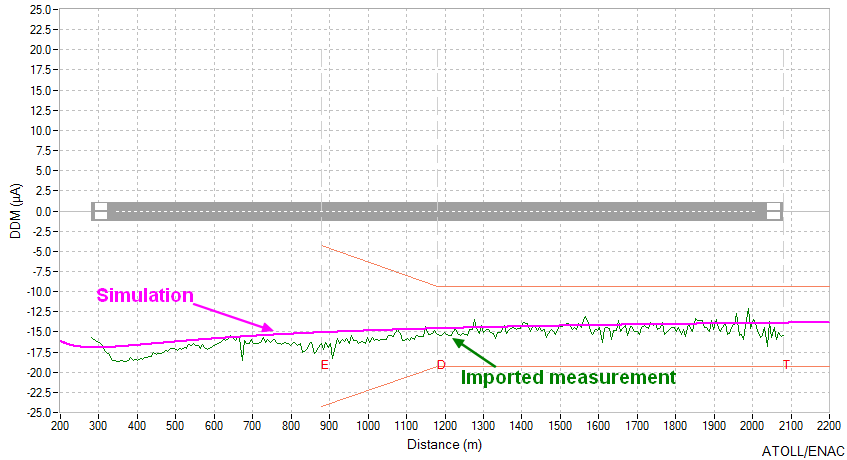
Importing ground or flight inspection measurement
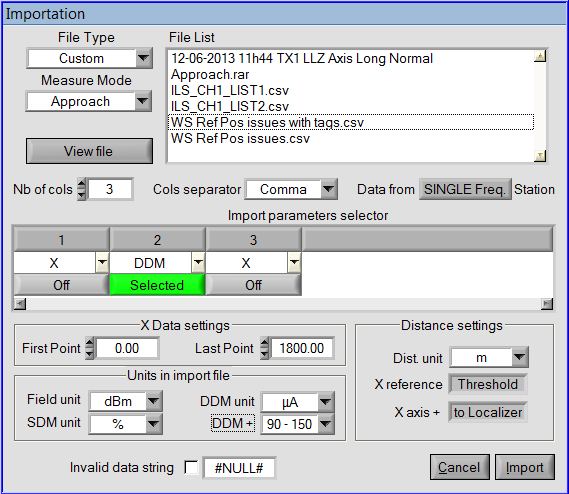
In order to analyze accurately data from measurement and to compare them easily with simulations
it is possible to import data from any source.
The import window allows to set the data format to the one used in the file you want to import.
Example of data importation
Receiver features
The time constant and the speed of the receiver can be adjusted. These parameters are taken into account when the filter button is ON and allow filtering of the raw data.
DDM and SDM behaviour from some commercial receivers can be selected for the simulations.
A more complex receiver taking into account the Doppler Effect is also available and the antenna type used by the receiver can be selected.
Editing features
The curves can be printed, copied to the clipboard or the data can be exported for post processing in a spreadsheet like Excel for example. It is also possible to import measurements in order to facilitate the comparison between measurements and simulations.