
LAGON (Learning About Glide for Overall Needs)
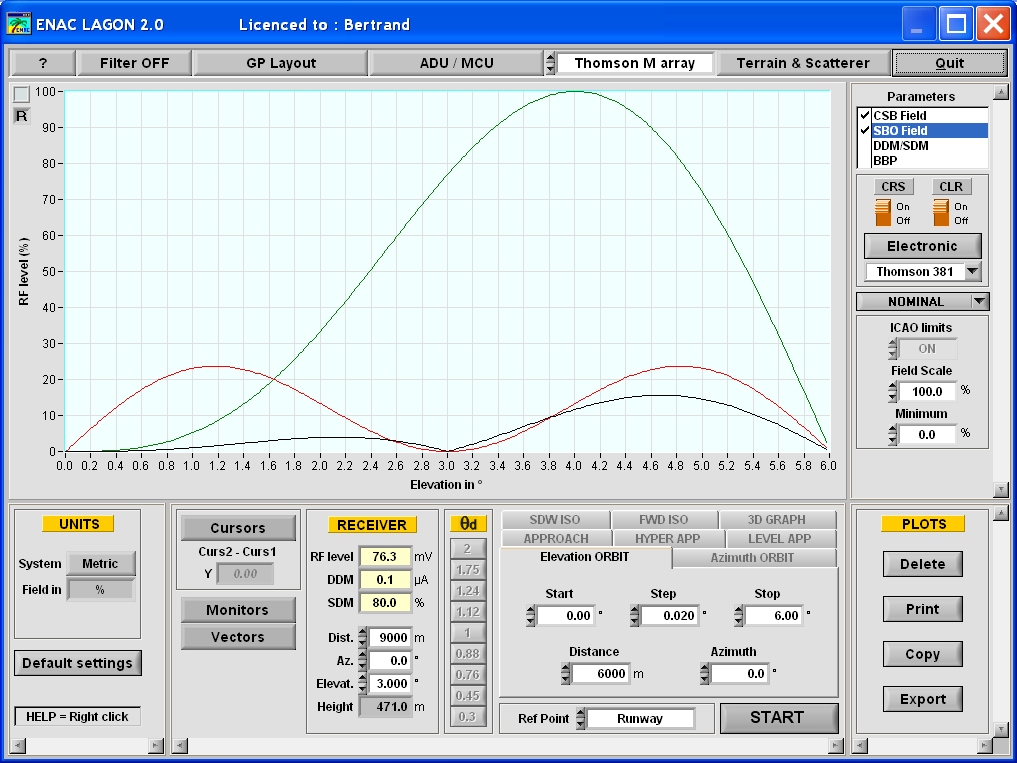
The software is organized around the main panel that displays the curves and gives access to the different adjustment and configuration panels.
Glide path layout panel
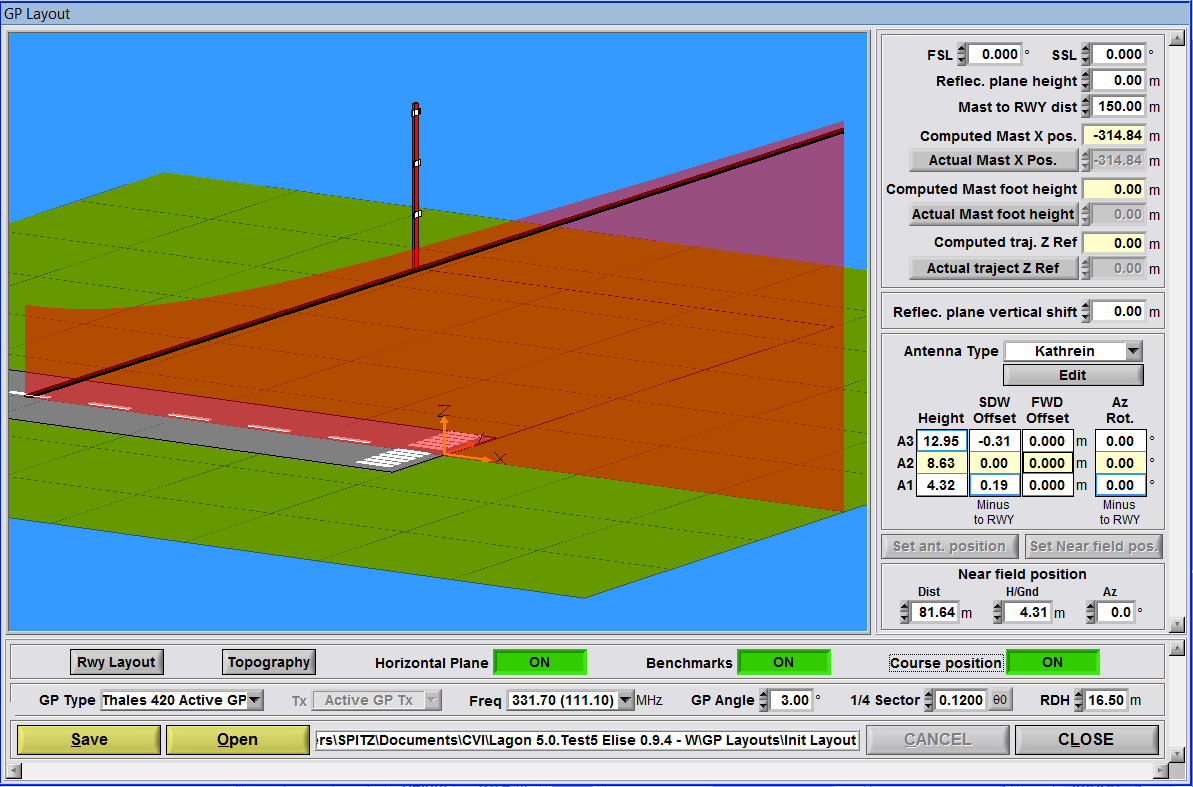
On this panel all mechanical and geographical settings can be adjusted.
It is also possible to save a complete layout including GP type, transmitter type, etc. for later use.
Topography panel
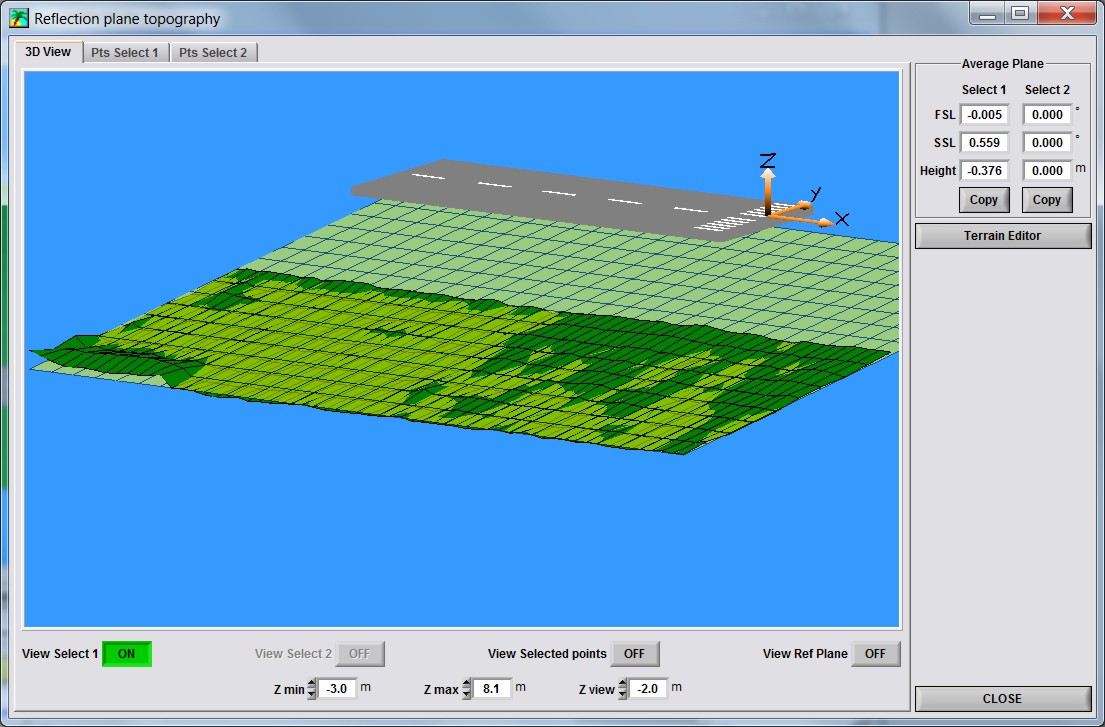
With this panel you can compute the average reflection plane from a site survey. These parameters can then be used in the GP Layout panel to set the mast and antenna positions.
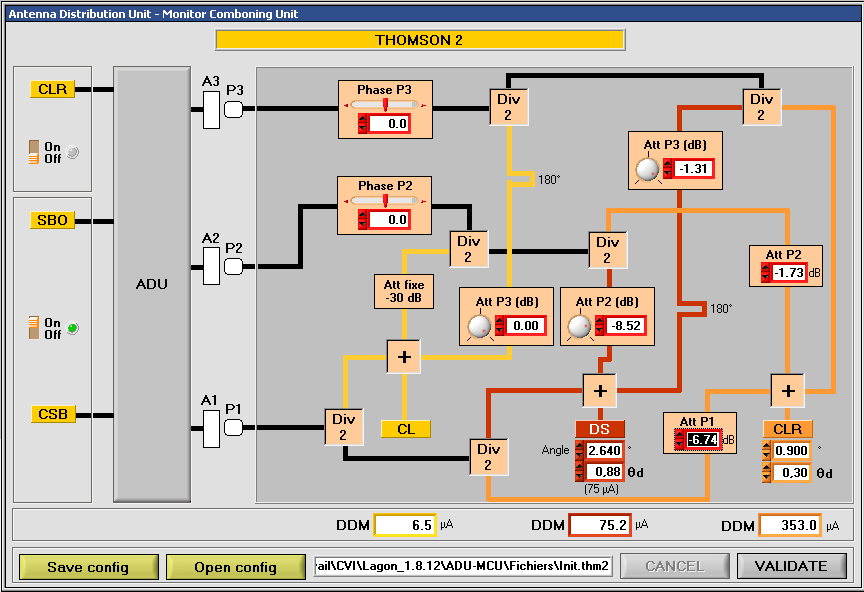
ADU/MCU panel
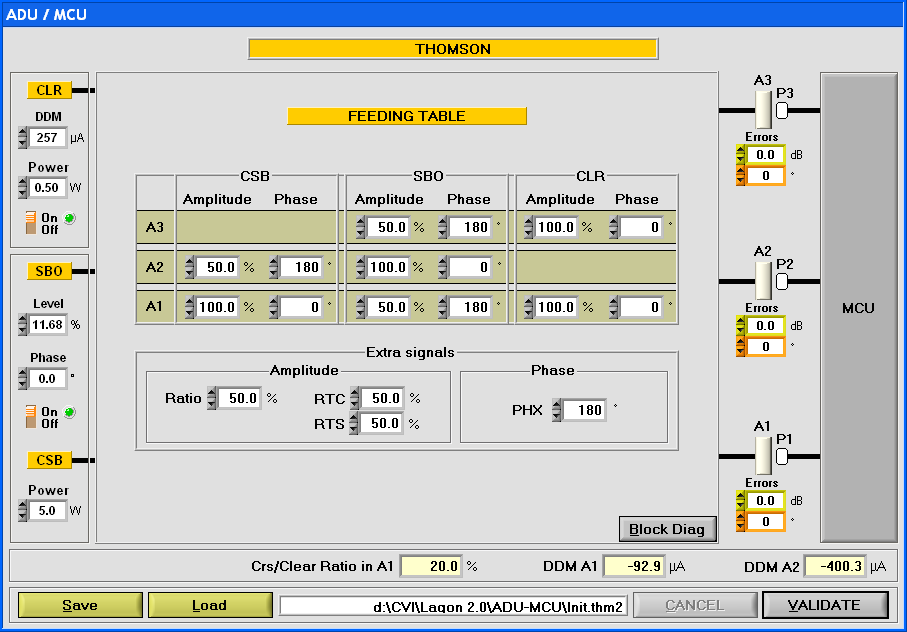
This panel gives access to antenna distribution parameters and to the monitor-combining unit.
All ADU parameters are displayed and can be changed. For the M array the extra signals can be set separately in order to facilitate some optimising trials.
Some transmitter adjustments are also available.
It is also possible to display the ADU block diagram and make adjustments using the real setting features.
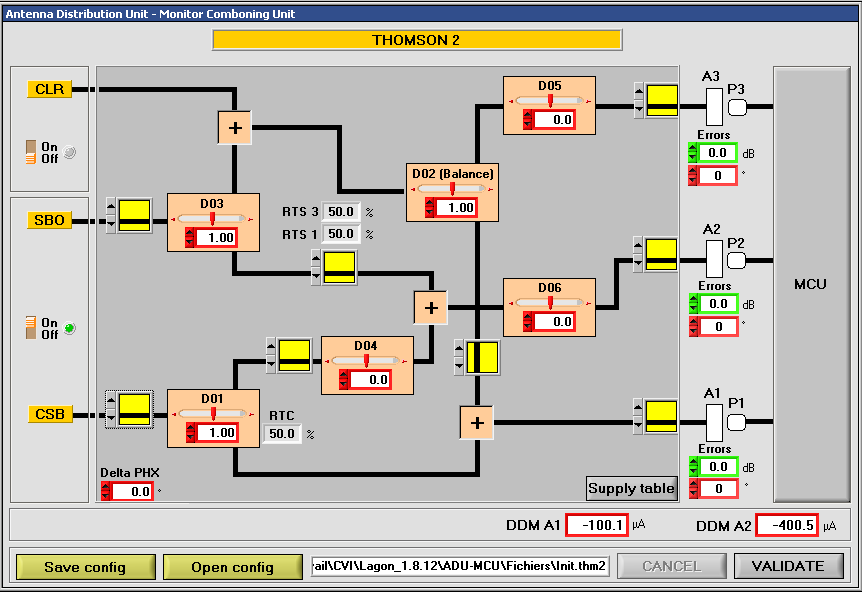
A click on the MCU button displays the MCU block diagram with all the settings.
Scattering objects and terrain profile Panel
In this panel one can add Scattering objects and a Terrain profile in front of the glide path antenna array.
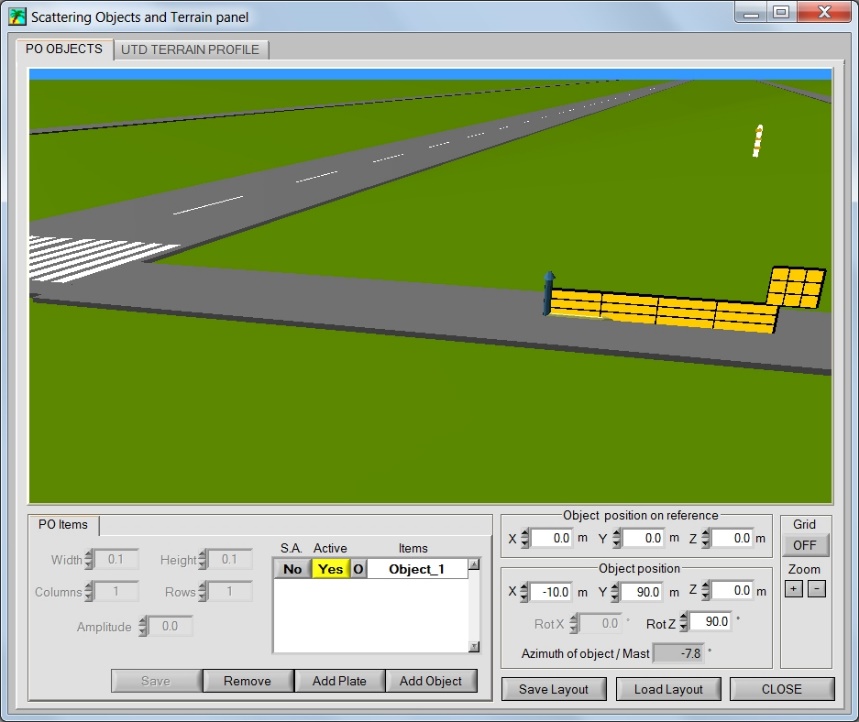
PO OBJECTS gives the possibility to add scattering plates or objects consisting of a set of plates. The method of Physical Optics (PO) is used to compute the signal scattered from these objects.
UTD TERRAIN PROFILE gives the possibility to add some terrain unevenness in front of the glide path by defining a terrain profile. The Uniform Theory of Diffraction (UTD) is used to compute the signals scattered from the terrain irregularities.
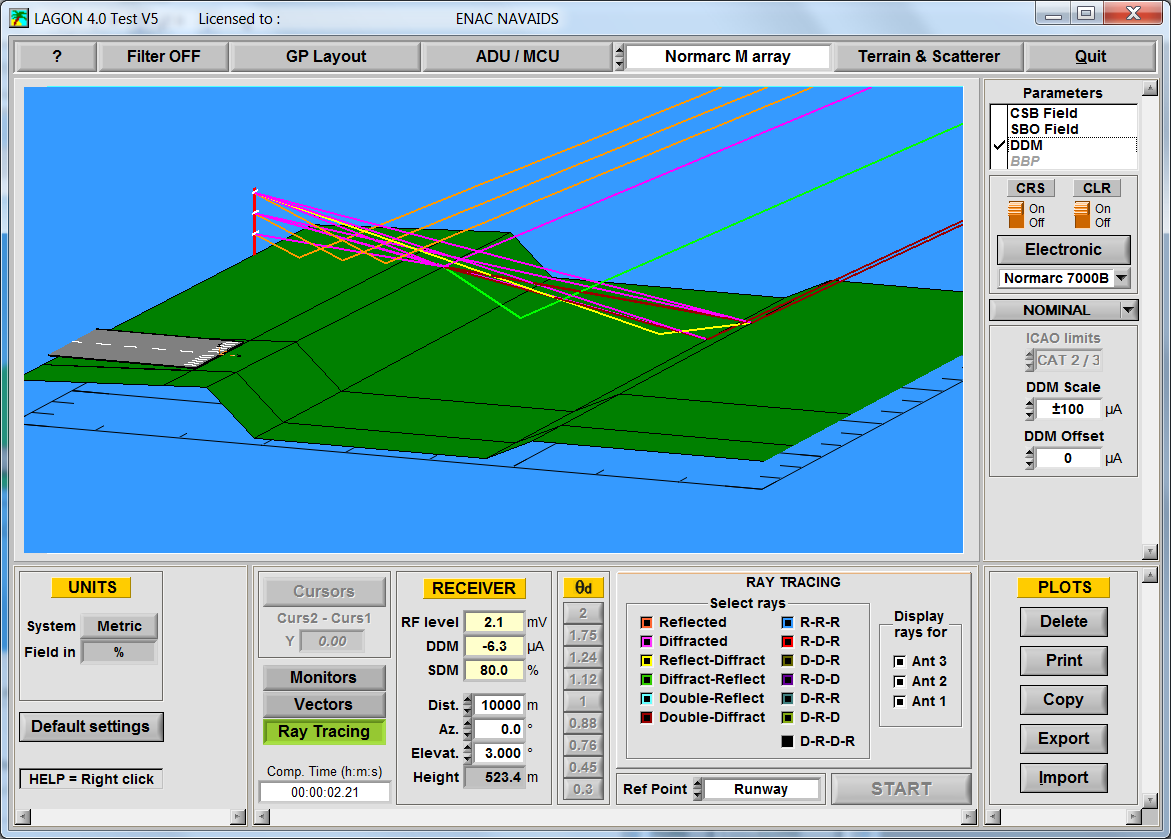
Measurement modes
Several measurement modes are available:
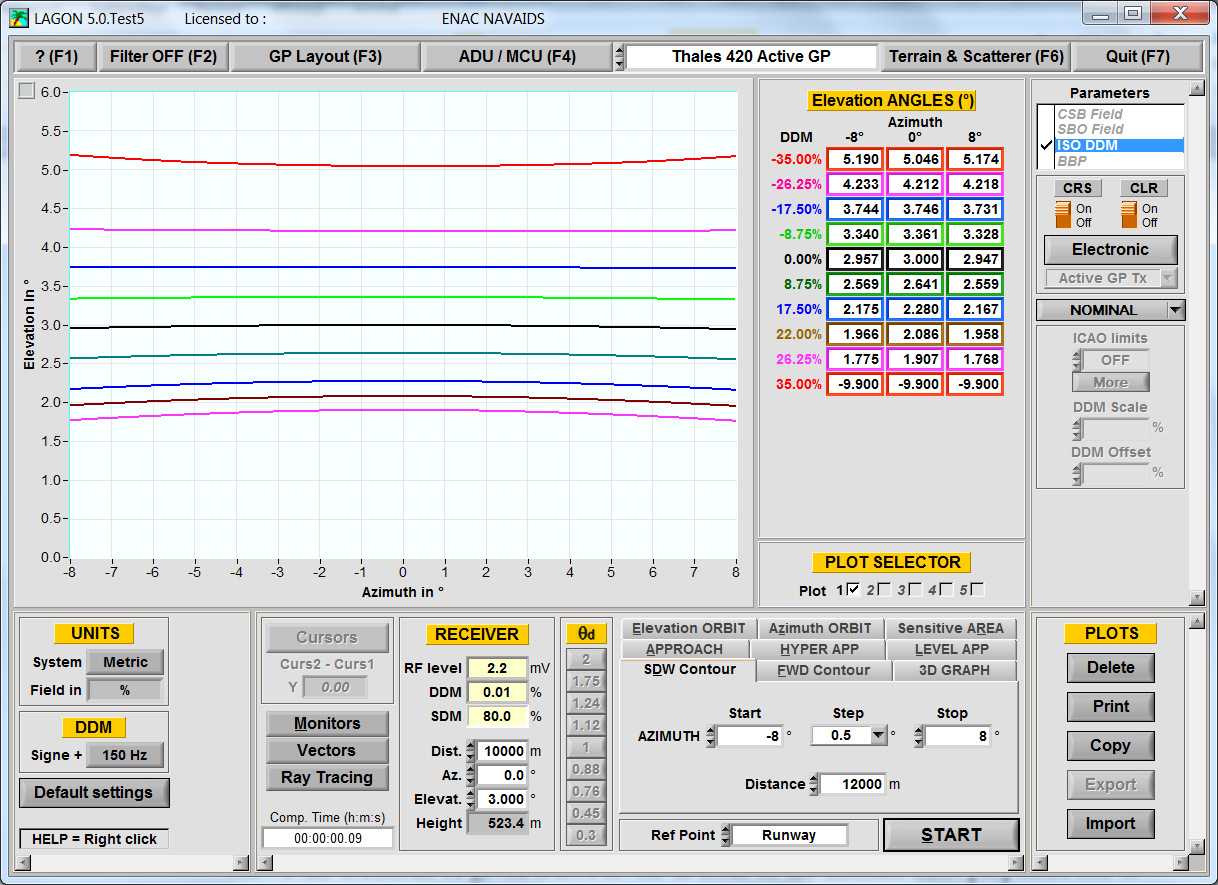
- Elevation Orbit
- Azimuth Orbit
- Approach
- Hyperbolic approach
The receiver follows the theoretical DDM=0 track. - Level approach
- Sensitive Areas
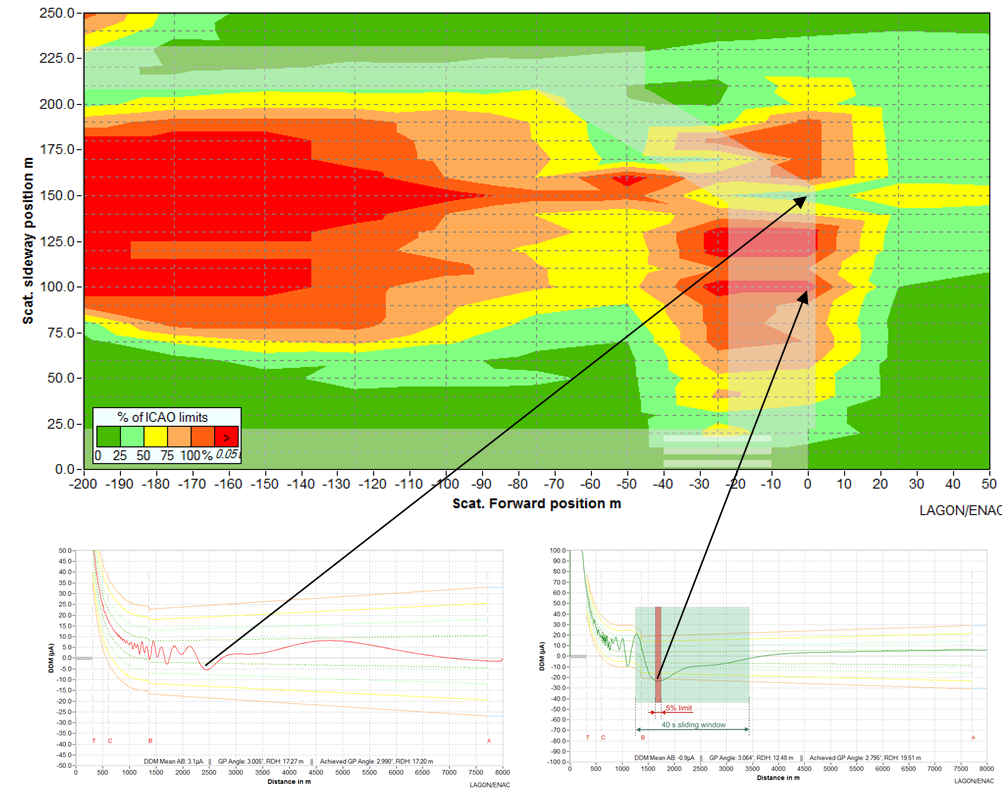
This function displays a color map were each color is depending on the maximum DDM disturbance cause by a scattering object set a different locations.
- Sideway Contour DDM curves
Shows the locations of given DDM levels in front of the antenna mast perpendicular to the runway. This view is sometimes called Window diagram.
- Forward Contour DDM curves
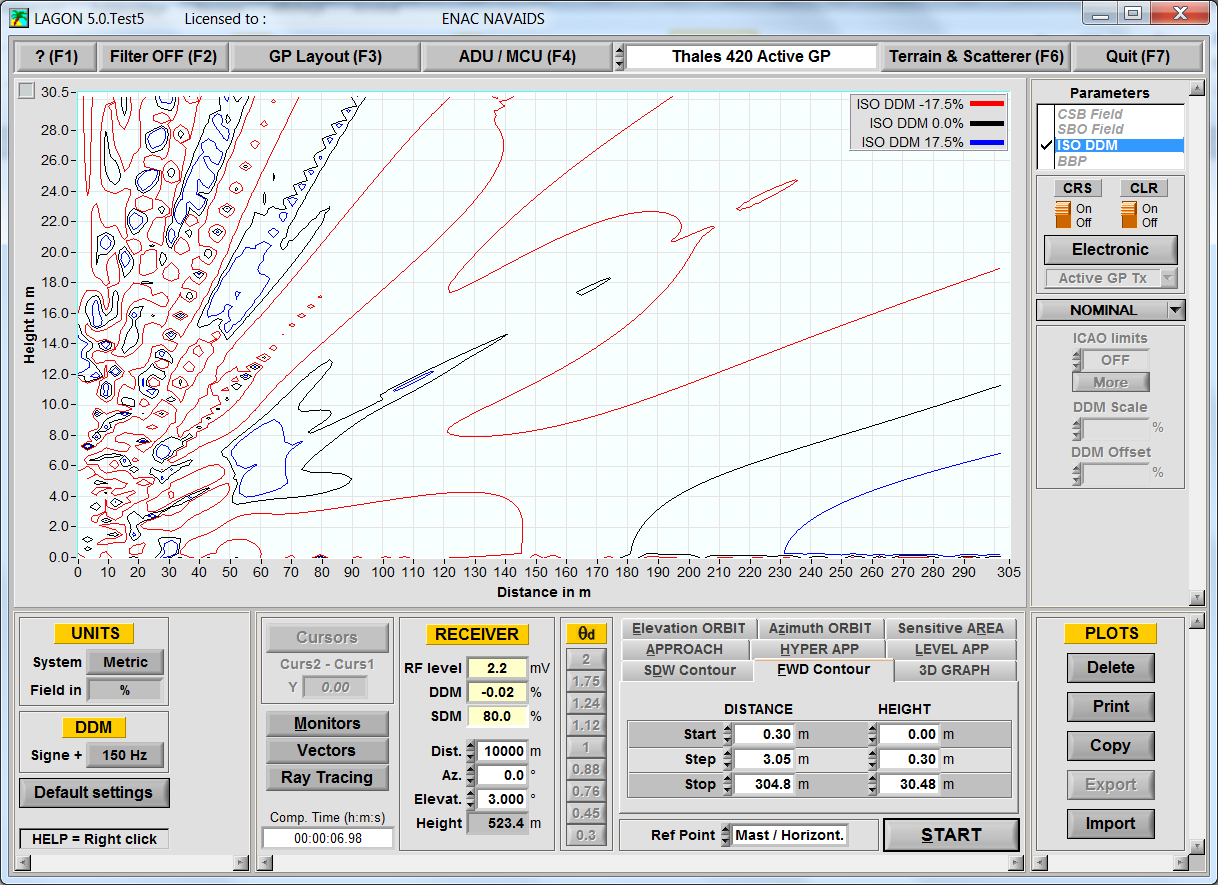
Shows the locations of DDM = -150µA, 0µA and +150µA in front of the antenna mast parallel to the runway.
- 3D graph
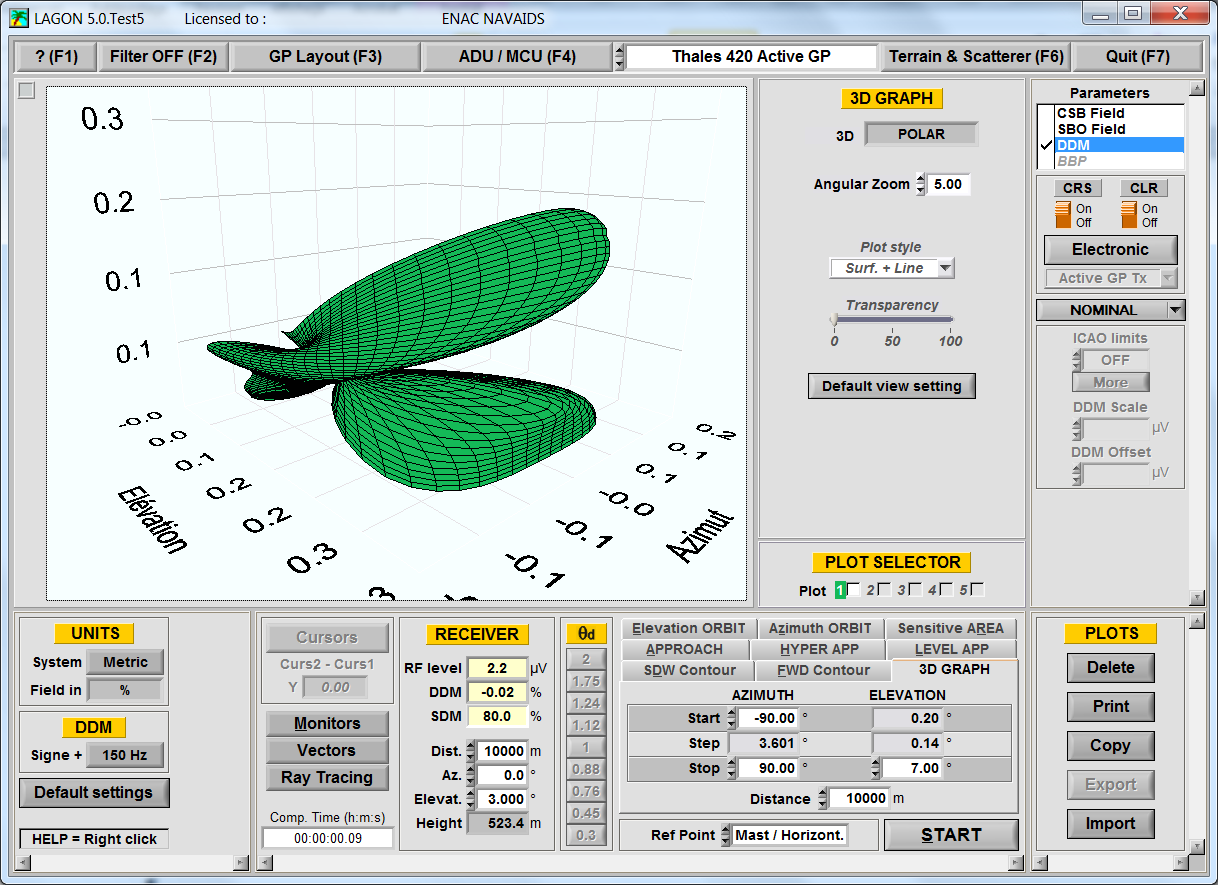
Gives a 3D view of the DDM or the radiation patterns.
- Static receiver
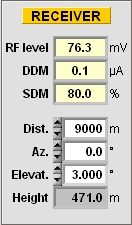
The static receiver allows measuring the GP parameters at a given position in space
- Monitor and far field and near field readings
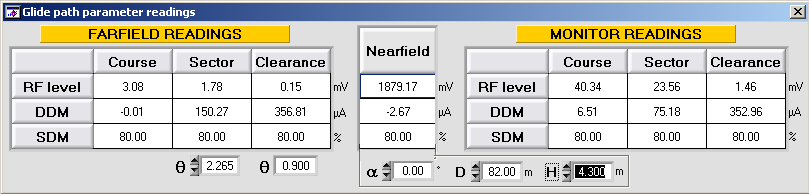
Here you can check the behavior between different measurement point.
Vector diagrams
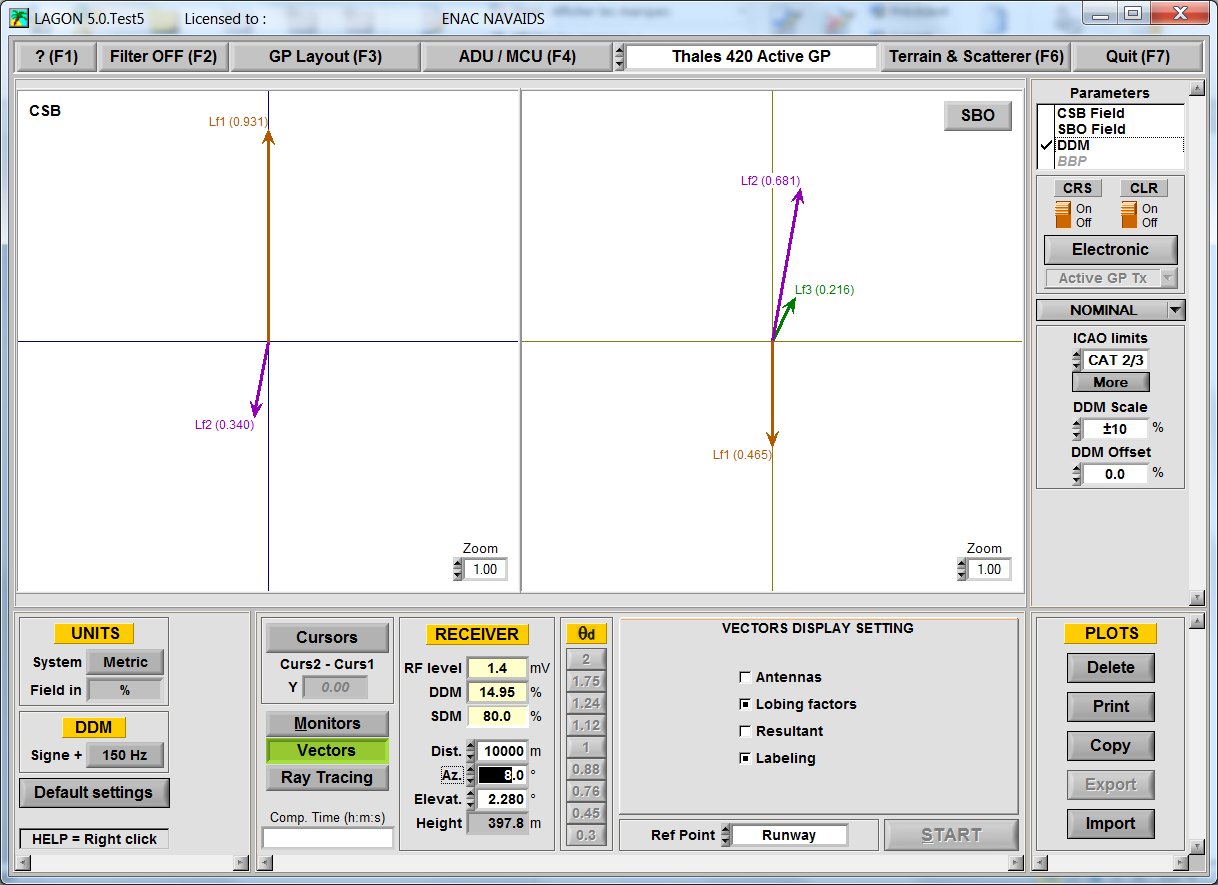
It is offen conveniant to represent the radiated signals with vectors because they give at the same time the amplitude and the phase. The vector diagrams are helpfull for a better understanding of all adjustment parameters on a Glide path and for troubleshooting.
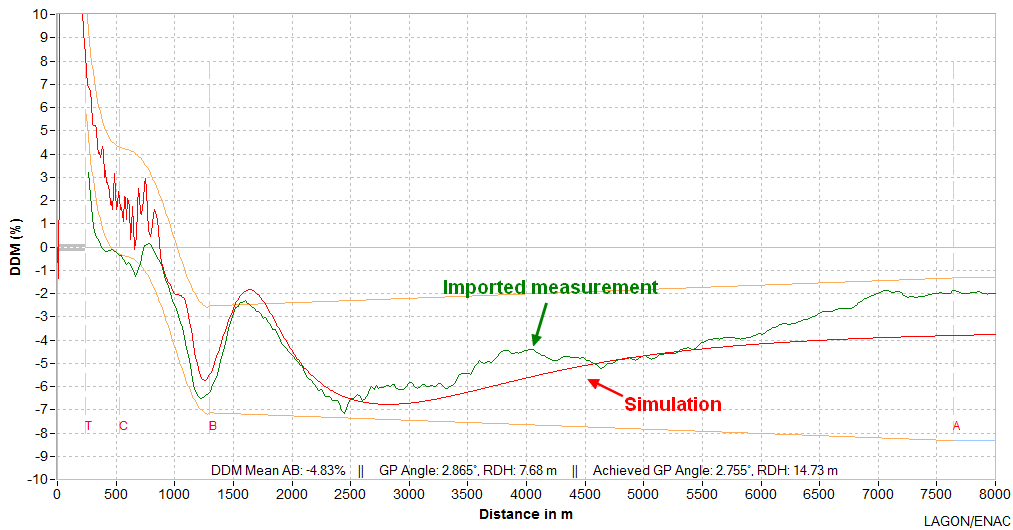
Importing flight inspection plots
It is possible to import data recorded either by ground measurements or by flight inspections.
This permits a better comparison between simulations and measurements.
Editing features
The curves can be printed, copied to the clipboard or the data can be exported for post processing in a spreadsheet like Excel for example.